Transportation capacity sees ‘accelerated contraction’ in February
A February survey of logistics executives showed growth in the supply chain is “increasing at an increasing rate.”
The Logistics Managers’ Index, a reading on changes in several areas of the supply chain, increased 4.2 percentage points during February to 71.4%. The reading was notably higher than the historical average of 62.7% and well above the February 2020 level of 52.6%.
The LMI is a diffusion index wherein a reading above 50% indicates expansion and a reading below 50% indicates contraction. The survey is designed to capture the rate of change in areas like transportation, inventory and warehousing.
“The combination of tight capacity and high prices are the primary drivers behind the increasing rate of growth detected in this month’s LMI,” the report read. A couple of categories — transportation prices (88%), warehousing prices (79%) and inventory costs (76.8%) — hit their highest levels in more than two years.
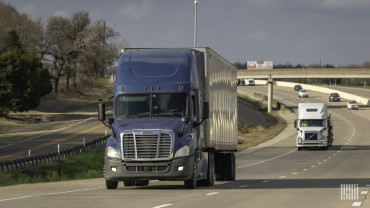
Transportation capacity falls further
The transportation capacity subindex remained in contraction territory for the ninth straight month, falling 8.2 percentage points from January to 38.1%. The “accelerated contraction” in February was seen in all modes of transportation.
Trucking continues to struggle to find drivers after a year when driver schools churned out 40% fewer graduates and the Drug & Alcohol Clearinghouse snared more than 50,000 drivers. Roughly 60 container ships remain anchored off the West Coast awaiting a berth to unload, and railroad intermodal networks continue to struggle to right service woes.
The transportation prices subindex was up 7 percentage points from January, nine straight months of increases, with the 88% mark establishing a fresh two-year high. The pricing index is 39 percentage points higher year-over-year.
Elevated prices are expected to linger. The one-year forward-looking expectation for prices was 86.8%, significantly higher than January’s sub-80% reading.
Transportation utilization was up 9.2 points to 73.5%, just shy of the two-year high.
While not called out in the report, severe winter storms further tightened truck capacity in February as many carrier networks were down for days at a time. Tender rejections increased significantly as the month progressed and the industry worked through freight backlogs.
.

Warehousing capacity was down 3.2 points to 42.4%, a level that is 18.4 percentage points lower year-over-year. Utilization of warehouse space remained firm at 70.2%, with prices staying elevated at 79%.

Chart: LMI, CSCMP
Inventory costs, up 1.8 points to 76.8%, and inventory levels, 1.5 points higher to 64%, rounded out the February changes to the subindexes.
“So, on top of the increased demand that came from clogged ports and the increased growth rate for e-commerce due to the pandemic, it is likely that there will be a heightened rate of growth through the foreseeable future. This will likely lead to a continued crunch on available logistics capacity, and increased rates of growth in price,” the report stated.
The LMI is a collaboration among Arizona State University, Colorado State University, Rochester Institute of Technology, Rutgers University and the University of Nevada, Reno, conducted in conjunction with the Council of Supply Chain Management Professionals.
