Shippers return to their old ways of detention as carrier compliance increases
FREIGHTWAVES' SONAR CHART OF THE WEEK (Mar 18 - Mar 24, 2019)
Chart of the Week: Detention Minutes, Outbound Tender Rejection Index - USA (SONAR: WAIT.USA, OTRI.USA)
LinkedInFacebookTwitterEmailDiggReddit
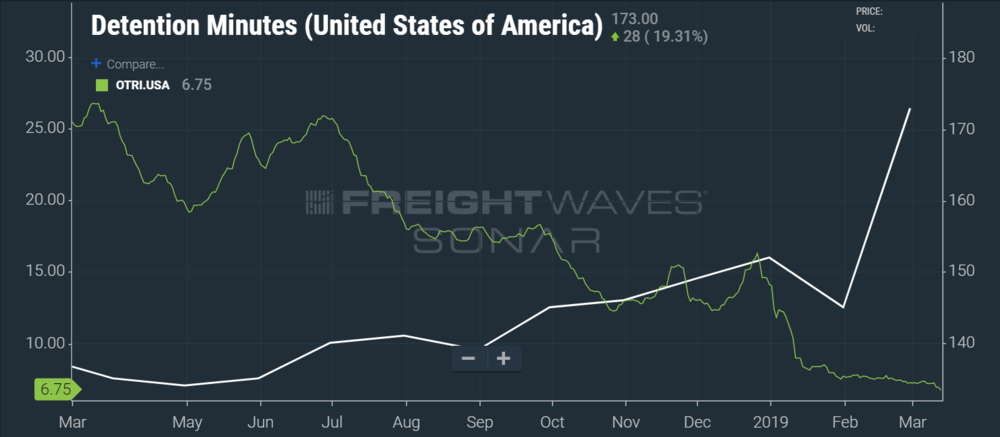
LOADING AND UNLOADING TIMES ARE INCREASING AS CARRIERS ACCEPT A LARGER PERCENTAGE OF THEIR TENDERED LOADS. (SONAR: WAIT.USA, OTRI.USA)
As the freight market has stabilized and become more balanced, shippers have realized they regained a lot of the control they lost in the previous 18 months. This power shift is reflected in the chart comparing tender rejection rates to average wait times.
Rejection rates reflect carrier compliance with shippers. When carriers are less compliant with their contracted accounts, they have more options for truck utilization, often a higher paying option.
Wait times reflect the sense of urgency a shipper has for loading or unloading a carrier. When a shipper is concerned about their relationship with their carrier, they will not keep them on their dock as long. Shippers know detaining a truck for long periods of time hurts carrier efficiency and drives up carriers’ costs, and therefore makes them less desirable as a customer.
Until 2017, shippers had little reason to consider making their carriers’ lives easier. After all, the carriers should be happy for the opportunity to haul their freight so they can keep their drivers happy and their trucks rolling. This is the mentality of a person or entity that has enormous leverage, something the larger shippers have 90% of the time. The reason they have this leverage is due to the highly fragmented and competitive nature of trucking. There are over 4,500 trucking companies with at least $20 million in revenue, all competing for freight volumes that are increasingly unreliable in terms of predictability.
It isn’t the shipper’s fault they feel empowered. Carriers send their sales team or representative out into the world to generate revenue armed with three basic offerings: capacity, rates, and service. Individual carriers have no control or visibility over the general availability of capacity in the national freight market. The largest carrier in the country, Knight-Swift, manages no more than 2% of the total for-hire truckload market. Roughly 90% of carriers manage fleets of less than 20 trucks.
Rates are a function of capacity and costs. With no visibility or control of any significant share of national capacity, the supply side of the equation, carriers can’t manage rates consistently unless there are significant changes on the demand side where shippers need more capacity than is available.
This is what happened in 2017 when several unexpected demand-increasing events created imbalance in the freight market economics in a relatively short time across the U.S. The effect of those events lasted well into 2018, but now appears to be diminishing, as evidenced by declining carrier tender rejection rates and spot market prices.
With the market in relative balance, carriers no longer have two of their three main negotiating tools with their customers, the shippers. Service is effectively all that is left to lever the rates. With so many carriers available, there are plenty of options for shippers to get the service they need at a decent price. The shippers do not need to spend as much energy to achieve the desired result.
Most people are no different. Think of the attractive girl or guy in high school, they tend to get more offers for dating without much effort. After a while, they realize they do not have to work as hard to gain the attention of the opposite sex. Shippers simply realize they are the attractive entity. Of course, not all shippers act in this manner, but this is a common behavior among consistently imbalanced relationships.
Any industry where competition is high, prices are kept low. This ultra-competitive market is why carriers celebrate 5-7% margins. Higher margins are typically the result of operational efficiency and not increased prices since 90% of the time the market is oversupplied.
Shippers should beware of this behavior, however. This past year should have been a warning sign to all the shippers that missed their budgets. Even though long running events are uncommon, there are many times throughout the year when specific regions are severely undersupplied. These scenarios can wreck annual budgets.
Having a consistent relationship with your carriers gives you and your vendor a better functioning long-term relationship with more stable costs. There are hidden costs in high vendor turnover situations, just like employees. Freight markets like the one seen in 2017-18 are more easily managed when the relationship is balanced between carrier and shipper. Inevitably the majority will not follow this advice, but those that do will enjoy consistent returns.
About the indices presented in this article
Detention Minutes -USA- (SONAR: WAIT.USA) - Detention minutes is an average of the time a trailer spends at a dock either loading or unloading. Drop trailers are excluded from the data. The clock starts after one minute on the dock, so it is not measuring the amount of time after what is considered acceptable or “free” for carriers, as that is a moving figure. Higher load/unload times are considered bad for carriers as they interrupt load planning cycles and decrease utilization.
Outbound Tender Rejection Index - USA (SONAR: OTRI.USA) - The Outbound Tender Rejection Index measures the rate at which carriers are rejecting their electronically tendered loads. A higher tender rejection rate is an indication that the carriers have more and potentially better paying options in the market for use of their trucks, therefore putting upward pressure on rates.
About Chart of the Week
The FreightWaves Chart of the Week is a chart selection from SONAR that provides an interesting data point to describe the state of the freight markets. A chart is chosen from thousands of potential charts on SONAR to help participants visualize the freight market in real-time. Each week the Sultan of SONAR will post a chart, along with commentary live on the front-page. After that, the Chart of the Week will be archived on FreightWaves.com for future reference.
SONAR aggregates data from hundreds of sources, presenting the data in charts and maps and providing commentary on what freight market experts want to know about the industry- in real time.
The FreightWaves data-science and product teams are releasing new data-sets each week and enhancing the client experience.
